This is the
1st step of creating the Free Network Administration Workstation.
I was trying
to create a free Network Administration Workstation for office network with
help of my freinds too.
as we try
some trail softwares and they end up with costy expereance so we think about
something be free of course Linux
we tried
with CentOS-07, Ubuntu 16.04, Ubuntu 14.04 aka Trusty.
we found
Trusty is good for this
It was the
easiest OS to install packages for this application.
So this post
is about installing the RRD-Tool (Round Robin Database Tool) Cacti which
collects time series data such as
1.network bandwidth
2.temperature
3.CPU
load of network devices
and which is
used to monitor up/down status of devices/links with SNMP and which can act as
a Syslog server too.
after you install Ubuntu 14.04 desktop Don't upgrade the
system to latest version
lets start it
Be the root user 1st..
sudo su
Enter the following commands to upgrade the packages..
apt-get update
apt-get upgrade
Install Apache web server, MySQL database, PHP..
apt-get install apache2 mysql-server php5 libapache2-mod-php5
Process will halt to ask for a MySQL root password

Install RRD-Tool
apt-get -y install rrdtool
Install SNMP
apt-get -y install snmp snmpd
Install Cacti
apt-get -y install cacti cacti-spine

Process will halt again to ask for the configuration parameters for the database..
Select apache2 then

Hit Yes


Enter a password for cacti to register with the MySQL database
Start the SNMP service..
/etc/init.d/snmpd start
Now open the web browser and go to the following link
http://


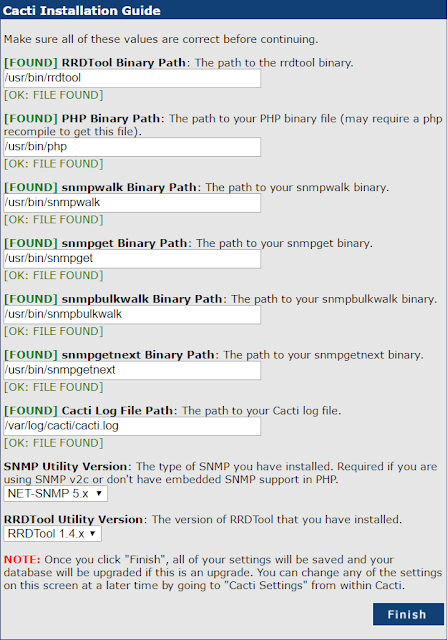
so follow those two steps and finished it

Enter the username: admin
password: admin
It will then ask to reset the password. Now you can give the password you want

To speed up the Poller process, select spine from Console -> Cacti Settings -> Poller

lets add
monitor plugin
Monitor plugin
lets you to view the up/down status of your host will sound an alarm when the
devices go down using icmp pings or snmp up time
Be the root
user 1st
sudo su
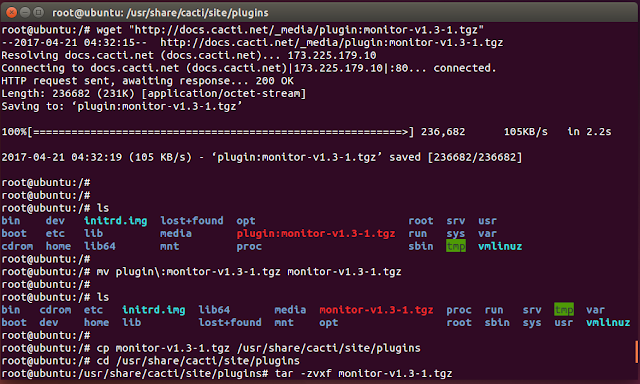
Get the
plugin
wget
"http://docs.cacti.net/_media/plugin:monitor-v1.3-1.tgz"
Rename the
downloaded file
mv
plugin\:monitor-v1.3-1.tgz monitor-v1.3-1.tgz
Move the
file to the plugins folder
cp
monitor-v1.3-1.tgz /usr/share/cacti/site/plugins
Change the
directory to the plugins folder
cd
/usr/share/cacti/site/plugins
Unzip the
folder
tar -zvxf
monitor-v1.3-1.tgz
Now log in to Cacti and go to Console -Plugin Management
You will see something like below

Click on blue icon in actions column


Now the plugin is added.
You will see a new tab for the plugin next to Console -Graphs
Log in to Cacti and go to Console - Devices

Click Add at the upper right side corner
Now fill the blanks as following. Give the IP address of the
Host name
Tick Monitor Host
Select ICMP Ping as Downed Device Detection - ICMP Ping as
Ping Method
Select Version 2 as SNMP version
Give your Community String to SNMP Community
Save
Now let's see the router side configurationbGive the
Community String with read-only rights..
R(config)#snmp-server community TEST r0
To allow SNMP traps to be sent to Cacti
R(config)#snmp-server enable traps
R(config)#snmp-server host version 2c TEST
I will add a video of working NMS later


